Setting Up Agent-Native Clips: The Free Loom Alternative That Captures Browser Errors

4:52 on a Friday. A message lands in the bugs channel: "dashboard won't load." Attached is a screenshot of a spinner, and nothing else.
I ask for a video. Ten minutes later, there's a link. I watch someone open a project, wait, and get an error banner. The video proves the bug is real. It says nothing about why it happened.
So the ritual starts. Open the app. Sign in as the right user. Open DevTools. Check the console. Switch to the Network tab. Reload. Hunt for the failed request. Copy the status code. Go back to Slack and ask whether they were signed in, what they clicked, and whether it happens every time.
The recording captured the symptom. The evidence stayed in a browser I can't reach.
Agent-Native Clips closes that gap. It's a free, open-source screen recorder that collects browser diagnostics while it records: console output, failed network requests, HTTP status codes, and the context around the moment things broke. You record the bug once. The video goes to the person watching, and the diagnostics go to whoever, or whatever, has to fix it.
If you'd rather watch than read, here's a quick look at Clips.
At the surface, Clips behaves like any async recorder. You record your browser, add your microphone and camera, save the clip, and share a link.
The difference is everything the clip carries with it. When you record through the Chrome extension, Clips can attach browser-level diagnostics:
What gets captured alongside the video
- Console logs and errors
- Failed network requests
- HTTP status codes
- The timing and context around the failure
- Structured metadata that an AI coding agent can read

That turns a video into something closer to a full bug report. Clips runs locally or in the free hosted version, and the extension provides the browser hooks that collect the diagnostics while you record.
A recording answers one question well: what the user saw. Watching someone reproduce a problem beats reading a two-line description of it.
Why a screen recording alone stalls the fix
The questions that follow are the expensive ones. Which endpoint failed? Whether the response was a 401 or a 502. Whether the browser threw a JavaScript error. Whether the frontend got malformed data. What happened in the second before the banner appeared?
Answering those means someone opens DevTools and investigates from scratch. The workflow most teams actually run looks like this:
- Record the bug.
- Open the console.
- Reproduce the bug again.
- Copy the relevant errors.
- Open the Network tab.
- Reproduce the bug a third time.
- Find the failed request and copy its details.
- Paste it all into Slack, Linear, Jira, or GitHub.
Every step leaks context. A non-technical reporter doesn't know which logs matter. A console message arrives without the request that caused it. A network failure vanishes on refresh. And asking someone to reproduce a bug three times can change the conditions that caused it.
Clips capture the visual and technical evidence together in the original recording. With it, the loop shrinks to four steps: start recording, reproduce the bug, stop, and share.
How to set up Agent-Native Clips
Setup has two parts: the Clips app, which runs locally or in the cloud, and the Chrome extension, which starts recordings and captures the diagnostics.
Install the Chrome extension
Open the Chrome Web Store, search for Agent-Native Clips, and add it to Chrome. The extension is what connects the screen recording to the browser's own record of what went wrong. Without it, you can still capture video, and you'll lose the automatic diagnostics.
Set up your camera and microphone
Chrome will ask for camera and microphone access the first time you open the extension. Enable them when you want to narrate or show your face.
Neither is required. A silent recording works well when the visible steps speak for themselves, and the diagnostics convey the technical detail. For a tangled bug, one spoken sentence saves a round trip:
"I'm signed in as an admin. When I open this page and click Refresh, the error appears."
Pin the extension to your toolbar
Pin Clips so it's one click away. Nobody digs through the Extensions menu while a bug is happening, and a visible button is what gets a problem recorded in the moment, rather than reconstructed on Monday.
Open the app you want to test
Get the application into the state that reproduces the bug before you hit record. Sign in with the correct account, open the relevant project, and navigate to the area near the failing interaction. Include enough context for someone else to follow along, and skip the three minutes of unrelated setup.
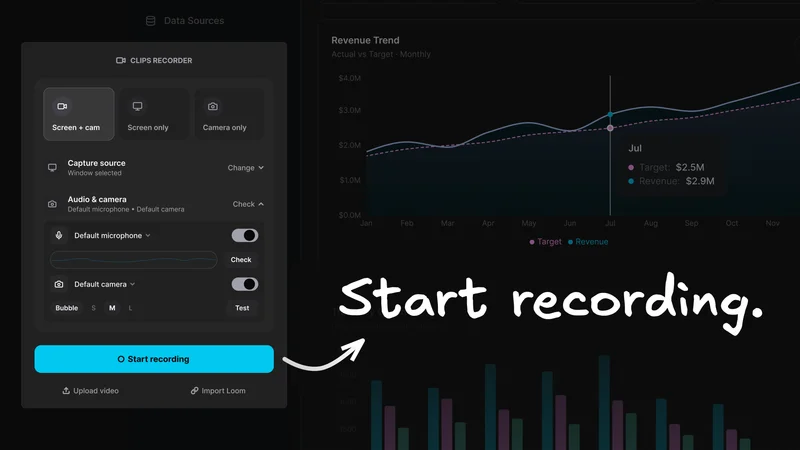
Start recording
Open the extension and start recording, then reproduce the issue as it actually happened. Same buttons, same inputs, same path.
Leave DevTools closed. The point is to capture the real user experience while Clips gathers the technical details in the background.
Reproduce the bug
In the demo, loading the app throws a visible network error. The page reports that something failed, and the browser logs several unsuccessful requests, including 502 and 401 responses.
A 502 means a gateway or proxy got an invalid response from an upstream service. A 401 means a request wasn't authenticated. Together, they point in several possible directions:
- A backend service is down
- An API gateway is failing
- An auth token is missing or expired
- The frontend is calling an endpoint that this user can't access
- One failed request is cascading into another
The video shows the banner. The attached diagnostics list the failed requests and provide the status codes you need to start narrowing it down.
Stop and save the clip
Stop the recording and save. The hosted version uploads the clip and gives you a shareable link. Running locally keeps the whole workflow inside your own environment.
Either way, the saved clip includes the recording and diagnostics from that session, so sharing it requires no exporting, formatting, or pasting.
What the diagnostics look like
The video is the visible half of a clip. The structured data is the half that does the work.
In the demo, the clip carries the console messages and network errors from the session, and the raw API response returns them as JSON. It isn't friendly to read, and it doesn't need to be. The JSON exists so tools can process the recording, not so a human can scroll through it.
An agent reading that payload can identify which requests failed, which status codes were returned, which console errors fired, when each one landed in the recording, and which on-screen action preceded them.
The clip ends up legible in two ways. A person watches the video. A machine inspects the data.
That's the "agent native" part. Most recordings are built for humans, so debugging details live outside the file: request URLs, response statuses, stack traces, and the order in which multiple failures occurred. Clips attaches that context, which makes the recording usable as an input rather than as evidence. You can hand a clip to an AI coding assistant and ask:
Find the request returning a 502, trace it back to the relevant code, and propose a fix.
Or:
Turn this recording into a GitHub issue with reproduction steps, expected behavior, actual behavior, and the relevant browser errors.
Turning a clip into a GitHub issue
A useful issue needs a description, reproduction steps, expected and actual behavior, a video, environment details, and the relevant logs and network failures. Assembling that by hand is why so many issues say "dashboard broken, see video."
With a diagnostic clip, the recording becomes the raw material. Paste it into your AI assistant, ask for a structured report, and it can combine the visible sequence, your narration, and the attached diagnostics into something like this:
Bug: Dashboard fails to load project data
Steps to reproduce
- Sign in to the application.
- Open the dashboard.
- Select the affected project.
- Refresh the page.
Expected behavior: the dashboard loads the project data.
Actual behavior: the page shows a network error, and the project never loads.
Diagnostics: the recording contains one request returning 502 and another returning 401.
The same clip works in Slack, where most bugs surface first. A screenshot and "Is this happening for anyone else?" start a thread full of guesses. One link plus one sentence, "this happens every time I refresh the project page, and the clip includes the browser logs and failed requests," gives everyone the interaction, the result, and the evidence at once.
Agent-Native Clips compared with a traditional screen recorder
| Capability | Traditional screen recorder | Agent-Native Clips |
|---|---|---|
Record the browser | Yes | Yes |
Microphone narration | Yes | Yes |
Camera video | Yes | Yes |
Show the visible error | Yes | Yes |
Capture console output automatically | Usually no | Yes |
Capture network failures automatically | Usually no | Yes |
Attach structured diagnostic data | Usually no | Yes |
Prepare context for an AI coding agent | Manual | Built in |
Open source | Varies | Yes |
Runs locally | Varies | Yes |
A standard recorder communicates what happened. Clips is built to help figure out why, which is a different job. If you're weighing the whole category, I compared ten options in the best Loom alternatives for 2026, and there's a closer look at Clips as a Loom alternative if that's the comparison you care about.
Who gets the most out of Agent-Native Clips?
- Developers get real context in the first report, rather than a screenshot and a follow-up question.
- Designers can catch broken states and layout bugs during review and file them without needing to learn the Network tab.
- Product managers can show the exact sequence of events that caused a bug, while the technical evidence rides along.
- QA teams produce richer reproduction reports without manually collecting browser output for every failure.
- Support teams can record a customer-facing problem and give engineering something actionable, within whatever privacy policy applies.
- Teams working with AI agents get the two inputs an agent needs: the user-facing behavior and the browser-level evidence.
Running Clips locally or in the cloud
The hosted version is the fast path. Record, get a link, drop it in Slack.
Run it yourself when the application handles proprietary data, when diagnostics must stay within your environment, when your organization has strict data-handling rules, or when you want control over storage and deployment. The source is on GitHub, so self-hosting is a fork away.
One caution either way: browser diagnostics carry more than error strings. Console output and network detail can include internal URLs, account identifiers, and application data. Treat a diagnostic clip as an engineering artifact, and check who can reach it before you share it.
Habits that make a clip worth watching
Keep it tight. Start close to the failure. Enough context to understand the state, but no unrelated navigation.
Say what the starting conditions were. Which account or permission level, whether it reproduces every time, which browser, and whether the bug needs a specific action first.
Reproduce it once, cleanly. Frantic clicking after the error makes it harder for a person or an agent to line up the action with the diagnostics.
Say what you expected. A broken result isn't always visibly broken: "When I click Save, the modal should close, and the new project should appear in the list. Instead, the spinner runs forever."
Watch what you record. No passwords, customer data, auth codes, or secret keys. Diagnostics widen the blast radius, so apply the same care you'd use when sharing production logs.
Frequently asked questions
Is Agent-Native Clips free?
Yes. Clips is free and open source, with a free hosted version and the option to run it yourself. The source lives in the Agent-Native repo on GitHub, so there's no seat pricing to plan around.
Does Clips work without the Chrome extension?
You can record video without it, and you'll lose the automatic diagnostics. The extension is what reads console output and network activity from the browser during a recording, so install it if bug reporting is why you're here.
What browser data does a clip capture?
Console logs and errors, failed network requests, HTTP status codes, the timing of each event relative to the recording, and structured metadata an AI agent can parse. Everything arrives attached to the clip rather than pasted in beside it.
Can I self-host Agent-Native Clips?
Yes. Clips runs locally or on your own infrastructure, keeping recordings and diagnostics within your environment. That's the setup to pick when the app under test holds proprietary or regulated data.
How does Clips compare to Loom for bug reports?
Loom captures the screen, and the browser evidence stays behind in DevTools. Clips records the screen and attaches the console and network data from the same session, which is why a Clips link can go straight to a developer or an AI agent without a follow-up round of questions.
Record the bug once
A bug recording should carry more than pixels. It should show what the user hit, preserve what the browser reported, and stay readable to both people and machines.
Without that, the person who finds the bug records a symptom and hands the investigation to someone who has to rebuild the technical context from scratch. With it, the context travels with the clip. A designer notices a broken page, records it once, and shares a link. A developer or an agent opens the diagnostics, connects the failed request to the endpoint or the frontend code, and proposes a fix. Nobody had to become a DevTools expert, and nobody started from an empty issue.
DevTools isn't going anywhere. Deep investigation still happens there. What Clips removes is the copy-and-paste layer in front of it, where logs lose context, requests get missed, and console screenshots become unsearchable images.
The console logs are already in the clip. So are the network errors and the status codes. You don't have to reproduce the bug again to go get them.
Record your next browser bug with Agent-Native Clips, install the Chrome extension before the next Friday afternoon report lands, and check the Agent-Native source on GitHub if you'd rather run it yourself.