A practical guide to Grafana alternatives, with a comparison table and decision framework. For teams that have outgrown assembling their own observability stack.
I love Grafana. I was an early employee and their first Community Engineer. I helped build some plugins still in use today. That product gave me hours of joy, and quite honestly, when it comes to data visualization, Grafana nails the dashboard layer.
It's free, open source, and plugs into almost any data source you can name. Pair it with Prometheus for metrics, Loki for logs, and Tempo for traces, and you've got the LGTM stack: a powerful, fully open-source observability setup that a huge share of the industry runs on.
But that was then. Today, in 2026, Grafana has shifted its focus to Grafana Cloud, paywalled its best features, and enterprise bills are skyrocketing. The new shape and nature of AI services doesn't fit their pull-based data model very well, and worse, their attempt to bring Grafana into the agent-native era has resulted in little more than a bolted-on chat window.
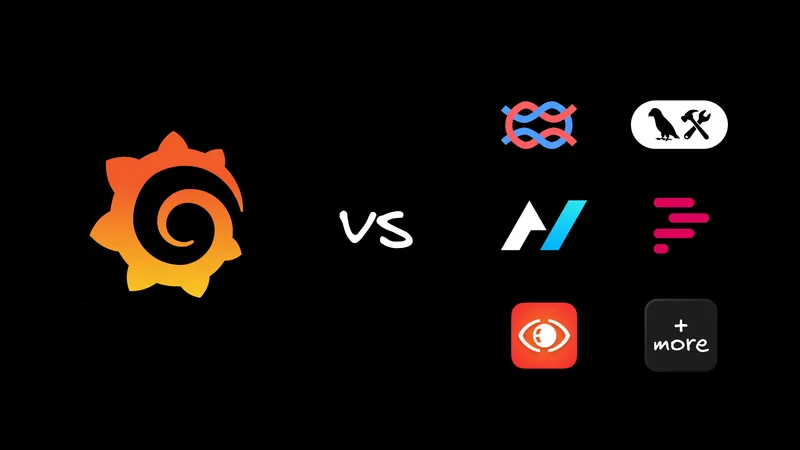
So, here are some options for when you outgrow the LGTM stack, are tired of Grafana Cloud's exorbitant bills, or you want a tool that solves the same problem with a different tradeoff. I've grouped the options by the job you need to get done.
If you'd rather watch than read, here's a quick look at Agent-Native Analytics, the open-source option on the list.
Quick comparison table
If you're skimming, start here. The rest of this post adds context to these columns.
| Tool | Category | Best for | OpenTelemetry support | Self-hosted option? | Pricing model |
|---|---|---|---|---|---|
Unified observability platform | High-cardinality. Big enterprises. Debugging on a single, OTel-native backend | Native, OTel-first | No, SaaS only | Usage-based (events) | |
Unified observability platform | One vendor for infra, APM, logs, security, and RUM | Full support alongside native agents | No, SaaS only | Per-host + per-GB | |
Unified observability platform | Full-stack visibility with a generous free tier | Full support | No, SaaS only | Consumption-based (per GB + per user) | |
Open-source product/business analytics | Natural-language dashboards without PromQL or SQL fluency | N/A, product analytics not infra | Yes | Free & open source | |
LLM observability & tracing | Tracing and evals for LLM apps, the open-source default | N/A, LLM-specific tracing | Yes | Free open source / usage-based cloud | |
LLM observability & tracing | Teams already built on LangChain/LangGraph | N/A | No, cloud only | Free tier + per-user | |
LLM observability & tracing | OTel-standard portability for LLM traces | Yes, OpenInference/OTel-compatible | Yes | Free open source | |
Open-source, OTel-native LGTM replacement | Datadog-like UX without leaving open source | Native, built on OTel | Yes | Free open source / usage-based cloud | |
Dashboards-as-code visualization | GitOps teams that want Grafana's dashboards under open governance | N/A, dashboard layer only | Yes | Free, CNCF open governance | |
Business intelligence platform | Reporting for Microsoft-stack and business-side teams | No | Report Server option | Per-user + capacity | |
Log-centric observability | Full-text log search and analysis at scale | Partial, via Elastic Agent/OTel | Yes | Free tier + paid subscription tiers |
What is Grafana?

Grafana is the open-source visualization layer behind the LGTM stack (Loki, Grafana, Tempo, Mimir). You point it at a data source, build panels and dashboards on top of it, and it stays vendor-neutral about where the data lives. Prometheus, Elasticsearch, CloudWatch, and dozens of others all plug in through its plugin ecosystem.
What to like:
- The plugin ecosystem is enormous. If a data source exists, there's probably a Grafana plugin for it.
- The self-hosted core is free and open source, a full-featured build rather than a gutless trial tier.
- It's the de facto standard, so hiring, documentation, and community dashboards are everywhere.
Tradeoffs to expect:
- Grafana doesn't store your data. You still need to run and maintain Prometheus/Mimir for metrics, Loki for logs, and Tempo for traces separately.
- High-cardinality dashboards get slow and expensive fast unless you invest real effort into backend tuning.
- Grafana OnCall's OSS edition entered maintenance mode and was archived in 2026, a reminder that pieces of the ecosystem shift out from under you if you're fully self-hosted.
Works well for:
- Teams happy to assemble and operate their own storage backends in exchange for maximum visualization flexibility and zero licensing cost.
Unified, fully-managed observability platforms
These options replace the entire LGTM stack with one vendor, one bill, and one pane of glass. You trade some backend flexibility for zero infrastructure-assembly work.
Honeycomb

Honeycomb is built OpenTelemetry-first from the ground up, and it's the strongest pick if your actual pain is exploratory debugging on high-cardinality data rather than pretty dashboards.
What to like:
- BubbleUp-style exploratory querying is good at surfacing "which specific attribute is causing this" without having to pre-build a dashboard for it.
- OpenTelemetry is a first-class citizen, not a bolted-on ingestion format.
- The unified events model means traces, logs, and metrics live in one queryable dataset instead of three stitched-together backends.
Tradeoffs to expect:
- It's enterprise only. Don't expect to test-drive the software before getting on a sales call first.
- It's SaaS-only, so a self-hosted path is off the table if that's a hard requirement.
- The mental model (wide events, not metrics-first) takes adjustment if your team has years of PromQL muscle memory.
Works well for:
- Teams standardizing on OpenTelemetry who want one backend to query instead of Grafana plus three others.
Datadog

Datadog is the category-defining unified platform: infrastructure metrics, APM, log management, RUM, and security monitoring under one roof with one login.
What to like:
- Breadth is unmatched. Hundreds of integrations mean almost anything in your stack reports in with minimal setup.
- One vendor, one bill, one UI instead of separately operating Grafana, Prometheus, Loki, and Tempo.
- Polished out-of-the-box dashboards and alerting reduce the time spent building what Grafana makes you build yourself.
Tradeoffs to expect:
- Cost predictability is the most common complaint. Per-host and per-GB pricing can climb quickly as you scale unless you keep tagging and retention disciplined. There's a reason the internet is full of memes about Datadog bills. Expect to pay. A lot.
- Breadth can mean depth trade-offs in any single pillar compared to a specialist tool.
Works well for:
- Teams that want to stop operating observability infrastructure entirely and are comfortable paying a premium for that.
New Relic

New Relic offers full-stack observability with consumption-based pricing and a notably generous free tier, making it an easier on-ramp than Datadog for smaller teams.
What to like:
- The free tier is large enough for real production use before you hit a paywall.
- NRQL provides SQL-like flexibility for querying across metrics, logs, and traces in a single place.
- Consumption-based pricing (data plus user seats) is simpler to reason about than per-host models.
Tradeoffs to expect:
- Data ingest costs still add up quickly at high volume, just like on any usage-based platform.
- The breadth of features can lead to a steeper learning curve when finding the right view for a given question.
Works well for:
- Teams that want a single managed platform but are more price-sensitive than typical Datadog customers.
The Best Free and Open Source Grafana Alternatives
If Grafana dashboards were never meant to answer "why did my agent fail on this call," this is the category built for that question instead.
Agent-Native Analytics

Agent-Native Analytics is Builder's open-source product and business analytics tool. It’s the tool we use internally for all our business needs from BI to session replay, and we’ve open sourced it for any team to use and improve.
Agent-Native analytics is closer to an open-source Amplitude/Mixpanel alternative than a Grafana clone, and it earns a spot here because it covers the same "dashboards and querying your data" job while skipping the need for PromQL or LogQL fluency.
What to like:
- Natural-language-to-SQL: Describe the chart you want in plain English, and the agent writes the query and builds it.
- Persistent, reusable dashboards with date controls and panels, not one-off chat answers you lose track of.
- Built-in connectors across CRM/revenue, engineering, and infrastructure (including Grafana itself as a data source), plus the agent can write new connectors on demand.
- Fully open source and self-hostable, so there's no per-seat or per-event pricing creeping up as you grow.
Tradeoffs to expect:
- It's product/business-analytics-first rather than infrastructure-metrics-first, so it won't replace Prometheus/Grafana for on-call infra monitoring (although it accepts both as datasources).
- Being younger and more agent-driven than Amplitude or Looker, some workflows assume comfort with an AI-first interface rather than a mature drag-and-drop BI tool.
Works well for:
- Teams that want natural-language, agent-modifiable dashboards over product and business data, and don't want to hand-write SQL or learn a query language to get there. Non-engineering teams who want to create ad-hoc dashboards from a plain-language prompt.
Langfuse

Langfuse is the open-source default for LLM observability: full tracing, prompt management, evals, and dataset tooling, with a self-hostable core under an MIT license.
What to like:
- Free and self-hostable at the core, a full product rather than a crippled paid-tier trial.
- Native integrations with LangChain, LlamaIndex, the OpenAI SDK, and the Vercel AI SDK cover most common LLM stacks out of the box.
- Tracing, prompt management, and evals live in one tool instead of three separate ones.
Tradeoffs to expect:
- Cloud pricing scales with observation volume, so cost planning matters once you're past hobby-tier usage.
- As with any younger open-source project, enterprise-grade compliance features are gated to higher paid tiers.
Works well for:
- Teams that want the open-source, self-hostable default for LLM tracing and evals rather than a fully managed vendor.
LangSmith

LangSmith is the first-party observability tool from the LangChain team, with the deepest possible integration if your app is already built on LangChain or LangGraph.
What to like:
- Every node, chain, and tool call in a LangChain/LangGraph app is captured automatically with no extra instrumentation work.
- Evals and collaboration features are built directly into the same product you're already tracing in.
- The free developer tier is enough to get real value from tracing before you need to pay.
Tradeoffs to expect:
- Deep integration is also a limitation. Teams outside the LangChain/LangGraph ecosystem get meaningfully less value than teams inside it.
- It's cloud-only, so self-hosting isn't an option if that's a requirement.
Works well for:
- Teams already standardized on LangChain or LangGraph that want tracing that requires effectively zero extra setup.
Arize Phoenix

Arize Phoenix is the open-source counterpart to Arize's commercial ML observability platform, and it's the strongest pick here if OpenTelemetry-standard portability matters to you.
What to like:
- Runs locally in a notebook or self-hosted, so you can start tracing before committing to any infrastructure.
- Built on OpenInference, an OpenTelemetry-compatible standard, so traces can move from local Phoenix to Arize's commercial cloud without re-instrumenting.
- Fully open source, avoiding lock-in to a single vendor's tracing format.
Tradeoffs to expect:
- The self-hosted/local experience is more DIY than a fully managed product like LangSmith.
- Evals and collaboration tooling are less mature than in purpose-built commercial platforms.
Works well for:
- Teams that specifically want OpenTelemetry-standard portability for LLM traces instead of a vendor-specific format.
Open-source, OpenTelemetry-native Grafana alternatives
If you want to stay open-source and self-hostable but you're tired of stitching four separate backends together, this is the category.
SigNoz

SigNoz is what a lot of teams picture when they say, "I want Datadog's UX without leaving open source." It's built natively on OpenTelemetry and backed by ClickHouse, unifying logs, metrics, and traces in a single self-hostable pane of glass.
What to like:
- Single deployable stack instead of Grafana, Prometheus, Loki, plus Tempo running separately.
- OTel-native from the start, so the instrumentation you already have mostly just works.
- Both a free self-hosted path and a managed cloud option, so you're not locked into operating it yourself forever.
Tradeoffs to expect:
- Younger ecosystem than Grafana's, so plugin/community-dashboard coverage is smaller.
- Self-hosting still means operating ClickHouse at scale, which is its own skill set.
Works well for:
- Teams that want the multi-backend sprawl of the LGTM stack gone without giving up open source or self-hosting.
Lightweight, dashboard-only Grafana alternatives
Not every team needs a full observability platform. Some just want dashboards, either GitOps-native or built for business reporting instead of infrastructure metrics.
Perses

Perses is a CNCF sandbox project built by former Grafana Labs and Red Hat engineers as a vendor-neutral, dashboards-as-code alternative to Grafana's dashboarding layer, specifically.
What to like:
- Dashboards are defined as code (CUE/YAML), so they live in Git, get reviewed in PRs, and version cleanly like the rest of your infrastructure.
- Kubernetes-native by design, with a CRD-based deployment model that fits GitOps workflows.
- Open governance within the CNCF removes the risk of single-vendor lock-in from your visualization layer.
Tradeoffs to expect:
- It's a younger project with a much smaller plugin/panel ecosystem than Grafana.
- It only solves dashboarding, so you still need your own metrics/logs/traces backends behind it.
Works well for:
- Platform teams that want dashboards-as-code and vendor-neutral governance more than they want plugin breadth.
Power BI

Power BI is Microsoft's business intelligence platform, a legitimate alternative for teams whose "Grafana" usage was just business reporting on top of a data warehouse. It targets business intelligence, not infrastructure observability.
What to like:
- Deep, native integration with Excel, Azure, and Microsoft 365 that most infra-focused tools can't match.
- Strong self-service reporting for business-side stakeholders who never wanted to learn PromQL in the first place.
- Report Server offers a self-hosted/on-prem path if cloud-only isn't acceptable.
Tradeoffs to expect:
- It targets a different job than Grafana's core use case, staying clear of infrastructure metrics, traces, and high-cardinality operational data.
- Per-user and capacity-based licensing get complex once you scale beyond a small reporting team.
Works well for:
- Teams that were using Grafana for business dashboards on structured data, not for infrastructure or application observability.
Grafana alternatives for log-heavy workloads
If your actual daily pain is searching mountains of logs rather than visualizing metrics, this category is a closer match than a general-purpose observability platform.
Kibana / Elastic Stack

Kibana is the visualization layer for the Elastic Stack, and its tight coupling to Elasticsearch makes it the strongest option here for teams whose workload is fundamentally full-text log search at scale.
What to like:
- Elasticsearch's full-text search and Lucene query syntax are best in class for digging through massive volumes of logs.
- The broader Elastic Stack (Beats, Logstash, APM, Security) covers most of the LGTM stack's jobs in a single project.
- A free, self-hostable tier exists alongside paid subscription levels for advanced security and ML features.
Tradeoffs to expect:
- Running Elasticsearch at scale is a real operational commitment. Sharding, resource sizing, and version upgrades all take dedicated attention. It's a Java-based, memory-intensive dinosaur and simply not fun to set up or maintain.
- OpenTelemetry support is improving, but is less native than purpose-built OTel platforms like Honeycomb or SigNoz. I'd prefer Clickhouse + SigNoz.
Works well for:
- Teams whose primary use case is log search and analysis first, with metrics/traces as a secondary concern. I'd still research SigNoz as an alternative.
Fixing the sprawl without losing the visualization speed
If your actual pain is operating four separate backends, the unified platforms and SigNoz solve that directly. If Grafana itself is fine and Prometheus is what's straining, VictoriaMetrics is a narrower, lower-risk fix. And if the thing you're debugging is an LLM or an agent, none of the classic Grafana-alternative options were built for that question in the first place.
Here's how I'd choose:
- Use Honeycomb, Datadog, or New Relic when your enterprise wants to retire the LGTM stack entirely in favor of a single, fully managed pane of glass. Be prepared to pay.
- Use Agent-Native Analytics when you want a true prompt-to-dashboard experience. Best for non-technical teams too.
- Use SigNoz when you want to eliminate sprawl but still need to stay open-source and self-hosted. s
- Use Perses or Power BI when you just need dashboards, not a full observability platform.
- Use SigNoz when your real workload is log search at scale. I'd avoid Elastic.
- Use Langfuse, LangSmith, or Arize Phoenix when what you're debugging is an LLM or an agent, not your infrastructure.
Dashboards matter, but only if they answer the question keeping you up at night.