Last week, I exported a CSV out of Google Sheets, pasted it into a chatbot, and asked it why signups spiked in August. It did a decent job. It found the increase, guessed at a cause, and drew me a chart.
Then I closed the tab, and it was all gone.
That's what analysis in a chatbot gets you. The work happens, and then it evaporates. Nobody else can see the chart; nothing was saved to a dashboard; and the next person to ask starts over with their own export, their own definition of "signup," and their own answer.
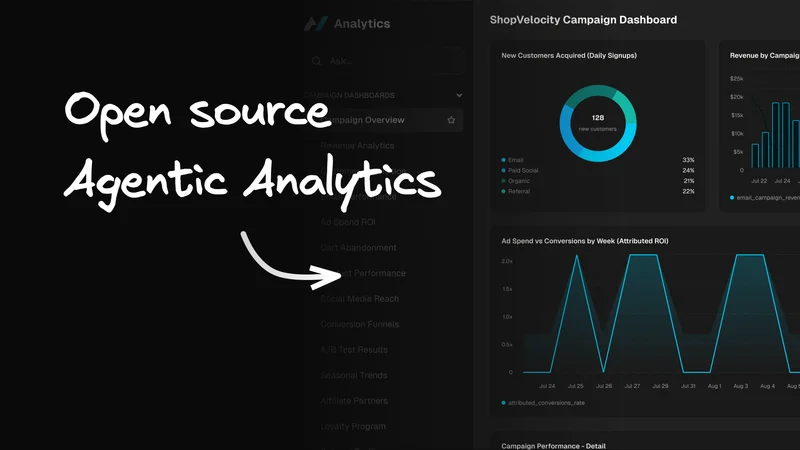
Agent-Native Analytics, the tool we use internally at Builder for this purpose and recently open-sourced, puts the agent inside the analytics product, next to the dashboards, metric definitions, and connected sources your team already uses. Ask for weekly active users over the last six months, and it checks the approved definition, writes the BigQuery SQL, dry-runs it against the warehouse, and renders the chart. Say "add this to the Growth dashboard and break it down by plan," and the panel saves itself into the dashboard while you watch.
Refresh the page. It's still there. That's what changes when the agent and the interface share actions, data, and current context.
If you'd rather watch than read, here's the full walkthrough of Agent-Native Analytics.
The chat box is only the front door
A chat interface is useful when a request is easier to say than to configure. But the chat box is only the control surface. What matters is whether the agent receives a structured application context and can use the same operations and records as the UI.
Agent‑Native is an open-source TypeScript framework built around a different relationship between the agent and the application. They share three foundations:
- Shared actions. A capability is defined once as a typed action. The agent can call it as a tool, while the interface calls the same implementation from code. Both paths use the same schemas, validation, permissions, and business logic.
- Shared data. Work created through the agent and through the UI lives in the same application data model. A panel saved in conversation is the same panel that appears on the dashboard.
- Shared application state. The agent receives relevant context, such as the current page, dashboard, filters, date range, or selected resource. That is what makes instructions such as “add this” and “break this panel down” meaningful.
For normal application work, the agent doesn’t need to click through the interface. It uses the same action layer as the UI.
If that framing is new to you, this is the background on why applications get built this way.
One analytics question contains a small specification
“Show weekly active users” sounds like a simple query. In a real company, it hides a set of decisions.
What counts as active? Which identities and events qualify? Which timezone sets the week? Which table is authoritative?
A query can be valid SQL and still answer the wrong question.
That’s why Analytics includes a living data dictionary for approved metric definitions, authoritative sources, join patterns, owners, and known caveats. The agent consults the vocabulary before writing dashboard SQL.
In our walkthrough, Weekly Active Users is an approved Growth metric with a specific source and definition. The private table name is incidental. What matters is that the meaning is explicit and reviewable.
The dictionary reduces guessing; it doesn’t make judgment unnecessary. Owners can review definitions, experts can inspect queries, and the team can update an entry when its business logic changes. Governance becomes part of the product instead of text pasted into every prompt.
From one question to a validated chart
Here’s what happens behind that opening request.
1. Consult the metric context
The agent begins with the question, the active organization, and the relevant screen state. It looks up Weekly Active Users in the data dictionary and uses the approved definition, source, and caveats as context for the work.
If the metric is missing or ambiguous, the honest response is to surface that uncertainty or ask for a decision. Silently inventing a definition would produce a faster chart and a weaker analytics product.
2. Choose the connected source
For this walkthrough, the source is the connected BigQuery warehouse. The connection is configured once and reused across questions, dashboards, and investigations. The user does not need to upload another export or redescribe the schema in every conversation.
Analytics can also work with configured sources for product, revenue, engineering, support, communication, and content. More important than the evolving catalog is that sources are durable, access-controlled application connections—not one-off prompt attachments.
3. Write and validate the SQL
The agent writes the panel query from the approved context. The SQL remains visible, so someone who knows the data can inspect the tables, joins, filters, and aggregations rather than accept a black-box answer.
When Analytics saves new or changed SQL for a BigQuery dashboard panel, it dry-runs that SQL against the warehouse before persisting the change. That catches problems such as invalid columns or tables before a broken panel becomes part of the dashboard. A successful dry run shows that BigQuery accepts the query; it does not prove that the business definition is correct. That still depends on the dictionary entry and human review.
4. Render the answer in the product
Once the query returns data, Analytics can render it as a chart, table, or metric, depending on the result. In this case, six months of weekly values become a time-series chart.
Users can ask the question without writing SQL, but SQL dashboard panels keep the generated query inspectable in the dashboard UI. Analytics also includes a separate SQL Query Explorer for direct BigQuery work. Natural language speeds up the path to an answer without removing the underlying tools experts need.
Returning the chart is useful. Turning it into a persistent, editable, shareable resource is the bigger step.
The answer becomes part of the product
The follow-up is deliberately contextual:
Add this to the Growth dashboard and break this panel down by plan.
“This” and “this panel” resolve because the agent receives the active result and dashboard as structured context. The user does not have to restate the query, paste a dashboard ID, or identify the chart again.
The action writes the panel into the dashboard’s saved configuration and breaks the result into the relevant plan series. Refresh the page or return later, and the panel remains. From there, a person can inspect the SQL, resize or reorder the chart, and share it; the agent can continue from the same state.
Persistence makes the result reusable. Governance makes it worth reusing.
One action contract serves both the agent and the UI
The Analytics template implements its shared-action model as typed contracts. A dashboard read declares its inputs, HTTP method, read-only status, agent exposure, and authentication requirements once. The UI calls that contract through application hooks; the agent receives the permitted contract as a tool.
An illustrative shape based on the open-source dashboard action looks like this; omitted implementation is marked explicitly:
The point is the contract. Validation and access boundaries do not disappear when an instruction arrives in conversation. A dashboard-composition action can validate panels, save the resource, and return a deep link. The agent does real work without becoming a privileged parallel product.
Relevant screen state completes the loop. Analytics can provide the current dashboard, filters, view, and selected resource. This is not omniscience or a browser dump; it is a structured context supplied by the application.
What does this change for product builders?
Analytics is one example, but the design test applies to any product in which an agent and a person need to have an ongoing role in the same work.
- Define capabilities as product contracts. If “create report,” “assign ticket,” or “publish page” exists only inside a click handler, the agent needs a second implementation. A shared action gives both surfaces one schema, permission boundary, and behavior.
- Make context explicit. The current page, selected record, active organization, and visible filters should be structured state—not clues the model has to infer from prose or pixels.
- Model durable artifacts. The most useful output is often not a message. It is a dashboard, document, ticket, campaign, or design that remains in the application after the conversation ends.
- Keep judgment visible. Agent-native does not mean hiding the work. Queries, definitions, approvals, errors, and revisions should be inspectable in the interface appropriate to the domain.
- Use an agent for work that is genuinely open-ended. A direct model call is simpler for one generated response, and ordinary application logic is better for a fixed sequence. The agent-native pattern earns its complexity when the agent and UI must keep collaborating on evolving work.
These choices change chat from a feature into one participant in the product’s operating model.
Analytics is more than text-to-SQL
The same model extends beyond the initial dashboard:
- Understand: reusable SQL and Explorer dashboards, saved investigations, the data dictionary, and direct SQL exploration.
- Publish: filters, saved views, sharing, scheduled dashboard email reports, and alert rules over first-party event counts.
- Operate: uptime checks, public status pages, error triage, and session replay with console and network context.
Here's what that looks like compared to a traditional dashboarding stack.
Connected sources span warehouses and configured SaaS systems. For registered providers, an API escape hatch can reach endpoints or filters not covered by built-in actions; adding a new source means extending the template in code. These surfaces do not all use one SQL path. What they share is that the agent works with real application resources while people retain an interface for inspection and control.
Start from a complete product, not a blank scaffold
We publish Agent‑Native Analytics as a hosted app and a complete open-source template. Rather than starting from a blank framework, the template includes the product UI, agent surface, application data model, authentication, and deployment structure. Agent‑Native calls this model Cloneable SaaS.
Metric definitions, exclusions, permissions, infrastructure, and review practices differ from company to company. With the template in a repository you control, developers and coding agents can change the interface, add actions, connect a source, introduce a visualization, and review those changes through the team’s normal engineering process.
That differs from the embedded product agent’s day-to-day role. It works through granted actions and integrations. Source changes require an explicitly equipped coding or workspace agent and normal review and deployment discipline.
Teams can control the application code, queries, deployment, and data stack. BigQuery remains the connected warehouse, while Analytics persists application resources such as dashboards, settings, analyses, and monitoring configuration in its own database. “Own your stack” is more accurate than claiming that no data ever crosses a system boundary.
Try the workflow yourself
Start with a question whose answer your team already understands. Try the hosted Analytics app, connect a source, and inspect the metric definition, generated SQL, and result before saving it to a dashboard.
Or create the complete Analytics template in your own repository:
The useful test is not whether the model can produce a plausible answer. It is whether the application turns that answer into durable work that people can inspect, edit, trust, and continue.
That is Agent‑Native: software in which people and agents operate through the same product—and build on each other’s work.
Try Agent‑Native Analytics or start from the open-source template. Then tell us what it should do next.