Experimental Performance Insights Panel in Chrome DevTools
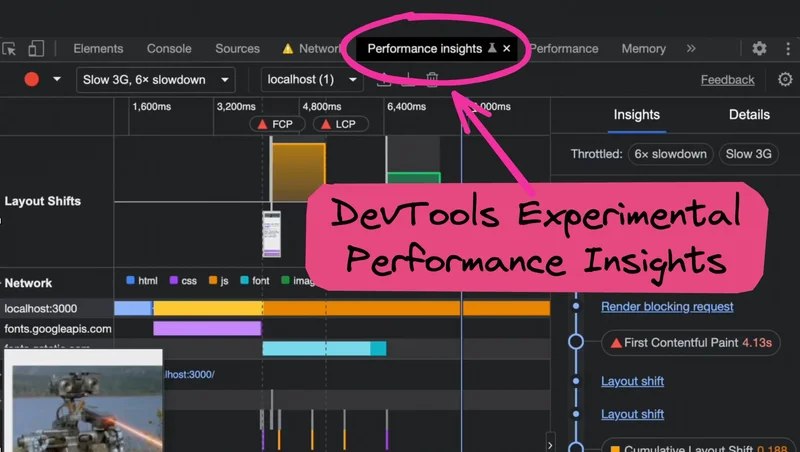
Have you tried Chrome DevTool’s Experimental Performance Insights panel? If not, let's explore some of its many slick features together.
While the existing Performance panel you may be familiar with has many (many) capabilities, it’s also quite overwhelming at the same time. The Performance panel suffers from trying to solve too many use cases, which is why the new experimental panel’s streamlined and simplified UI is a welcomed update.
If you don't already see the Performance Insights tab, you can enable it by going to More options icon -> More tools -> Performance Insights.
Alternatively, you can also enable Performance Insights through the the DevTools Command Menu.
Before we start our first Performance recording, I recommend enabling Network and CPU throttling to get a better idea of what users are experiencing in the real world. Additionally, disabling cache also helps to ensure we’re testing more realistic conditions for first-time visitors.
Click the "Measure page load" button for DevTools to reload the page begin the performance recording. It’ll automatically stop the recording a couple of seconds after the page load has finished.
Easily one of the best features of Performance Insights would have to be the playback feature. It allows you not only reply the entire performance recording, but also scrub and zoom into to exact moments within the record.
And making it even more powerful is how it visually lines up with the all the tasks the browser is performing at that moment, like network requests and rendering.
Performance Insights is more than just tooling, but also goes further into helping pin-point the problem, and recommend some solutions.
For example, the right-hand side lays out a timeline of what’s happened during the recording. Each section in the Insights panel provides a link to get more details.
In short, the new Performance Insights panel provides a lot more information and is easier to use than the existing Performance tab. Give it a try and let us know how it goes. Thanks for reading!
Hi! I'm Adam, Director of Technology at Builder.io. We make a way to drag + drop with your components to create pages and other CMS content on your site or app, visually.
You can read more about how this can improve your workflow here. You may find it interesting and useful!
Tip: Read the explainer guide on SEO Core Web Vitals.