Debugging Node.js, The Right Way
Did you know you can instantly debug Node.js as easily as frontend code?
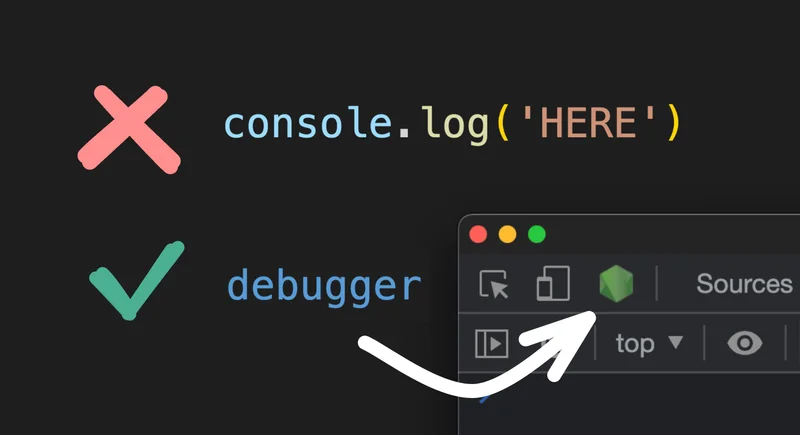
That’s right, you don’t need to rely on console.log() for everything.
And to top things off, you can even use the exact same browser devtools you are already used to using to debug your applications — including stopping on the debugger keyword, setting breakpoints, inspecting local state, and more.
First, you need to launch your node.js process using the --inspect-brk flag.
For instance, with node:
Or yarn:
Or npm
Now, open up any Edge or Chrome dev tools window and click this little green Node.js logo button:

A new instance of DevTools will open and connect to the node process!
If the Node.js icon isn’t there in DevTools:
- Go to the chrome://inspect url.
- Click Open dedicated DevTools for Node.
- Go to Connection tab
- Click Add Connection.
- Add a connection to match the port that node is listening on; for example,
localhost:9229.
If you want to debug a thrown exception, go to the Sources tab and click the octagonal button with a pause symbol. This causes Chrome DevTools to stop on any uncaught thrown exceptions.

You can also toggle the checkbox next to Pause on caught exceptions, but this might cause the debugger to stop on a lot of caught exceptions that other libraries use for feature detection or control flow.
This can come in handy if your exception is being handled by third party libraries.

Sometimes, there isn't a specific exception, just some weird behavior you've narrowed down to a specific function.
In this case, you can use the debugger statement to have execution stop when reaching the statement. It's useful to answer questions such as "what are the values of variables right now?" and "is this code even being executed?".

Left-click in the gutter to create a breakpoint.

Sometimes you want to debug a loop that executes many times before the error occurs. You can right-click in the gutter and click "Add conditional breakpoint..."
This prompts you for an expression to evaluate and only pauses the debugger when that expression is true. This lets you skip all iterations except the one of interest.


What's the difference between --inspect and --inspect-brk?
-inspect-brk pauses execution immediately when node starts while -inspect pauses execution if it hits a debugger statement and there is an attached debugger.
I usually prefer -inspect-brk because it gives me time to attach the debugger whereas when only using -inspect, the execution could finish before I have a chance to attach Chrome DevTools!
But what if you need to debug a node script that is launched with something other than node my-script.js (for instance, next dev or webpack build)?
You can do this by using NODE_OPTIONS, for instance:
Now you can run your Next.js app or any other node.js process and it will pause at start up and wait for the debugger.
You can also update your scripts in package.json accordingly, for instance:
Now anytime you run npm run dev-debug, you can open your browser devtools to inspect it at any point.
Let's recap the above in video form, for those of us that prefer visuals:
You can also debug directly in your IDE just as simply.
All you need to do is create a .vscode/launch.json file with any tasks you want to debug, for instance:
And that's all! Now you can enter breakpoints and debug directly in your IDE.
Additionally, you can even debug client-side directly in VS Code by specifying "type": "chrome" and providing a URL, like so:
Or, you can even debug both simultaneously (full stack debugging) by using the following configuration:
Pretty neat. Learn more about debugging in VS Code, or how to do similar in other IDEs such as Webstorm.
Now you can debug anything like a pro!
And hey, if you still want to use console.log() for debugging, we won’t judge you. But at least you have options.